April 2nd, 2018 by ryan
Our standard time-series graph interpolates between points. When the data you are displaying is price points, it’s not really valid to always interpolate. If the price was 0.40 at 2pm then 0.46 at 3pm, that does not mean it could be interpreted as 0.43 at 2.30pm. Amazingly till now, sqlDashboards had no sensible way to show taht data. Now we do:
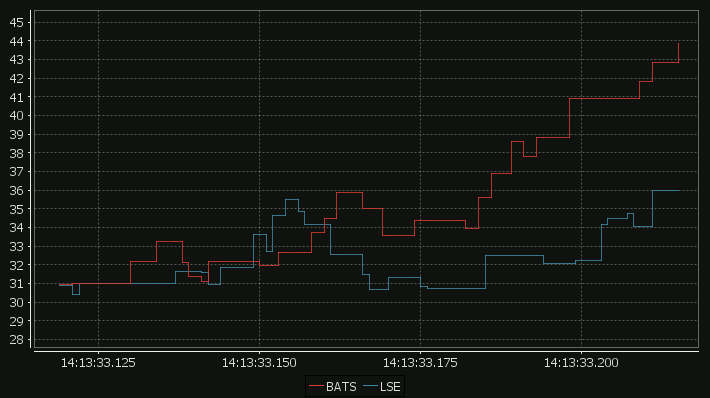
For comparison here is the same data as a time-series graph:
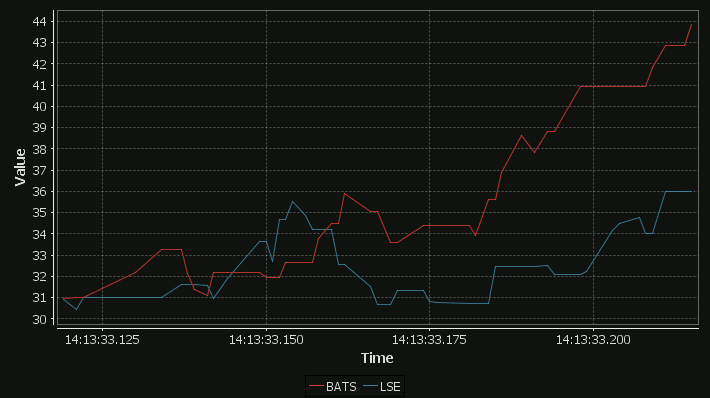
The step-plot is usable for time-series and numerical XY data series. The format is detailed on the usual chart format pages.
June 28th, 2016 by ryan
sqlDashboards 1.41 has been released and is available to download.
Changes include:
- Support custom JDBC drivers and Authentication Services
- Fix refresh rate display bug when widget is selected
- Fix sqlchart.bat to allow running from any current path
The custom JDBC/security has been asked for a couple of times but it’s inclusion at this stage is experimental. We do have a few customers using it with qStudio and documentation is available here. If this interests you get in touch.
April 18th, 2014 by ryan
I came across this interesting post on ASCII pie charts for MySQL. I thought I’d use our command line tool sqlChart todraw the database pie chart instead.
[raw]
[/raw]
Simply changing our mysql command to sqlchart and adding the additional arguments
"-o c:\temp\aa\sizes.png -c piechart"
gives us the following SQL Pie Chart:
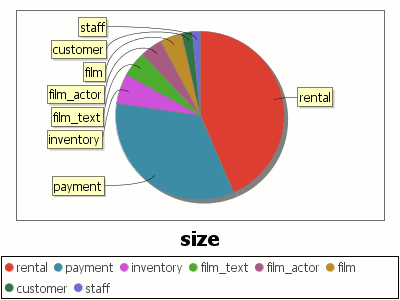
MySQL Sakila Table Sizes Pie Chart
Notice because sqlchart’s command line arguments closely resemble the mysql command line options, we can quickly change the calls from querying to graphing.