sqlDashboards adds Step Plot Visualization
April 2nd, 2018 by ryan
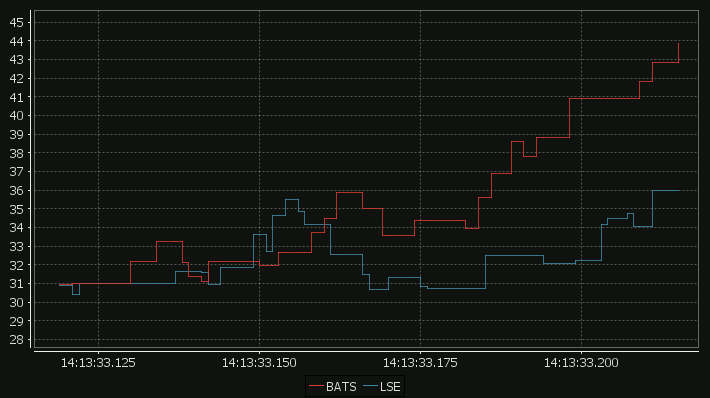
Our standard time-series graph interpolates between points. When the data you are displaying is price points, it’s not really valid to always interpolate. If the price was 0.40 at 2pm then 0.46 at 3pm, that does not mean it could be interpreted as 0.43 at 2.30pm. Amazingly till now, sqlDashboards had no sensible way to show taht data. Now we do:
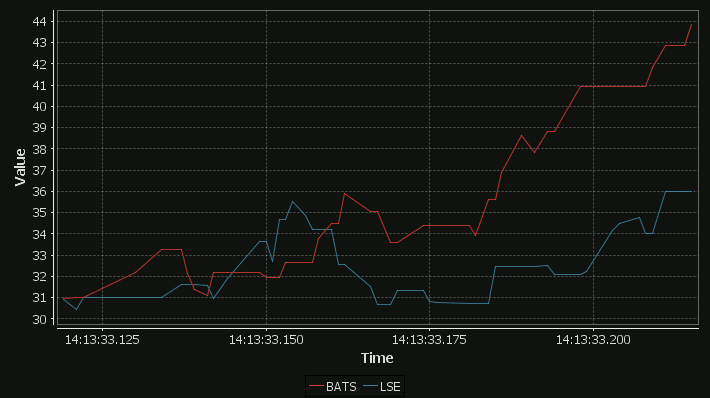
For comparison here is the same data as a time-series graph:
The step-plot is usable for time-series and numerical XY data series. The format is detailed on the usual chart format pages.
Hello,
Long time ago I suggested to add the capability to plot additional series plotted as lines or dots in the candlestick type charts so more columns could be represented.
Please, can I know if this feature has been added or if it will be added anytime soon?
Regards
Francisco