sqlDashboards supports Graphs,Nodes and State Diagrams
April 1st, 2018 by ryan
sqlDashboards is specialised for real-time data visualization. Often this includes monitoring the state of orders, whether that’s baskets of goods being ordered online or financial transactions, we want to help you see what state those items are in. To support visualizing this data we’ve integrated the most powerful open source graphing: DOT and graphviz. If you install graphviz and make it available in your path, you can automatically get sqlDashboards to generate graphs from tabular data, like so:
| From | To | label | cnt |
|---|---|---|---|
| PendingCancel | Calculated | Rejected | 50 |
| PendingReplace | Calculated | Rejected | 10 |
| PendingReplace | Calculated | Replaced | 40 |
| Calculated | PendingReplace | PendingReplace | 50 |
| Calculated | Filled | Trade | 9400 |
| Calculated | Calculated | Trade | 5239 |
| PendingCancel | Removed | Cancelled | 150 |
| Calculated | PendingCancel | PendingCancel | 200 |
| New | Calculated | Calculated | 9660 |
| New | Removed | Rejected | 140 |
| Created | Removed | Rejected | 300 |
| Created | New | New | 9800 |
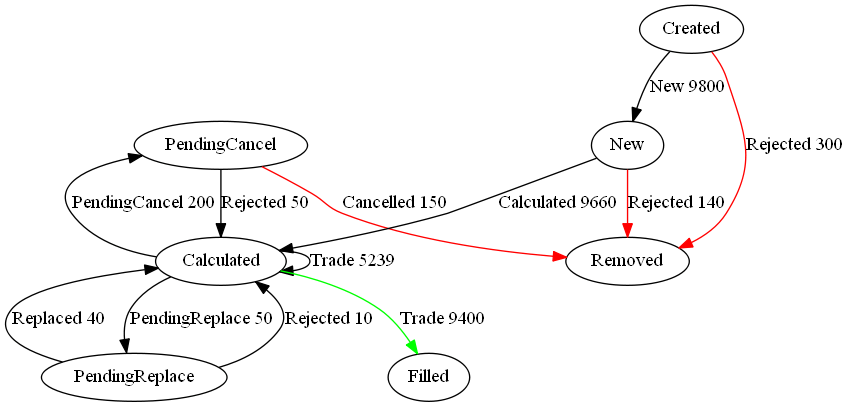
Notice to get the labels and styling you use a column called label or style respectively. The full format is detailed on the sqlDashboards example page.